
Earned Value Management (EVM)
Project Managers on construction and maintenance projects need a solid understanding of the fundamentals of Earned Value Management (EVM or Earned Value Analysis – EVA) and how to produce an S-Curve report to update stakeholders on the project’s health. EVM is a standard project management process that measures your project’s progress and performance by combining scope, schedule and cost – the iron triangle of Project Management – into an integrated system of monitoring and reporting.
Reports are typically presented as an S-Curve Report, which gives your project stakeholders a clear visual report showing how your project is trending.
Earned Value Management improves communication, reduces project risk and provides better forecasting, progress tracking and project visibility. It is the industry standard method of tracking project progress on capital projects.
This 1-Page summary in our Project Controls series gives you a downloadable quick Reference Guide on the fundamentals of earned value analysis including a EVM cheat sheet of the abbreviations, definitions and EVM calculations required to show your stakeholders your project’s current earned value, cost performance index (CPI) and schedule performance index (SPI).
This article will cover:
- What you need to get started with EVM on your project
- How to read an S-Curve report
- Example Earned Value calculation including how to calculate CPI and SPI
What You Need to Get Started:
1. A Project Plan
Your project plan will include your project’s scope, schedule, and costs. Project plans may also include resource loading and a quality plan.
Project Managers use tools like Oracle Primavera P6 or Microsoft Project to create their resource-loaded project schedule (or they simply use an Excel spreadsheet to organize their project – though managing projects in Excel can quickly become a headache). Project Managers will also integrate these tools with other software packages during work execution for daily progress tracking, delay tracking and timesheets.
2. What you plan to spend and what you expect to have done for the dollars spent
The project will have a budget that needs to be aligned to the completion of Activities which is the scope of the project. Your project plan will need to show that you plan to have X Activities Done by Y Date and it will cost you $MM.
For example: you have a project with 20 Activities and a budget of $5MM to be completed over 10 months. Your plan may say:
- Month 1 / 2 Activities Completed / $500K
- Month 2 / 4 Activities Completed / $1.15MM
- Month 3 / 7 Activities Completed / $1.75MM
- …
- Month 10 / 20 Activities Completed / $5MM
$5MM is your Budget at Completion (BAC) and the starting point for your Earned Value Management.
3. Metrics to quantify work % complete
Not all activities in your scope are created equal. You need to decide how you will measure when an activity in your scope is completed and how that will credit your overall percent complete on the project.
There are a few common ways that % complete for a project is quantified throughout the duration of the project:
- Physical % Complete – direct daily / weekly data from the foreman on the project in the field, based on their expert judgment of how the Activities have progressed
- Units % Complete – calculated by the actual labour and non-labour units completed divided by the Actual completed Units + remaining Units
- Duration % Complete – calculated as the delta between the Original (or Planned) Duration and the Remaining Duration divided by the Planned Duration
Whichever progressing method you decide to use you need to know how much work you’ve done on the project at any given point, what it has actually cost you to get that work done and what you had planned to spend to get that same amount of work done.
4. A method to track work execution on Activities
Getting quality data from the people actually executing the work in the field daily is critical no matter what your project is. No matter how you choose to get your daily data from the field you need to be capturing at a minimum:
- Actual % Complete
- Actual Costs
- Actual Hours Spent
- Actual Start / Finish
Of course the more field data you have the better you can understand the factors impacting your project delivery and develop plans for mitigating the risks to your project objectives in terms of schedule and cost performance.
5. Formulas to calculate Earned Value, Cost Variance, Schedule Variance, Cost Performance Index, Schedule Performance Index and Variance at Completion
There are 4 primary data points you need to begin with Earned Value Management and you should be able to calculate these data points for any data date on your S-Curve Report:
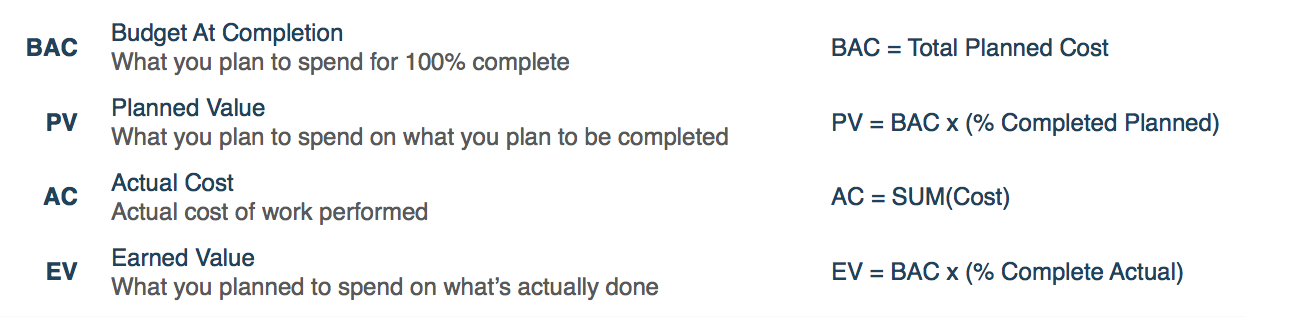
1. BAC = Budget at Completion (BAC)
What you plan to spend for 100% complete on the project
BAC = Total Planned Cost
2. PV = Planned Value (also called Budgeted Cost for Work Scheduled or BWCS)
What you plan to spend on what you plan to be completed
PV = BAC x (% Completed Planned)
3. AC = Actual Cost (also called Actual Cost of Work Performed or ACWP)
The actual cost of the work performed on the project
AC = SUM(Cost)
4. EV = Earned Value (also called Budgeted Cost for Work Performed or BWCP)
What you planned to spend ($) on what’s actually been done (work % complete)
EV = BAC x (% Completed Actual)
To Summarize:
From these data points you can calculate your project’s variances from the original project baseline plan, which are the real indicators to project stakeholders on how your project is progressing. The main variances Project Managers care about are Cost Variance, Schedule Variance and Variance at Completion:
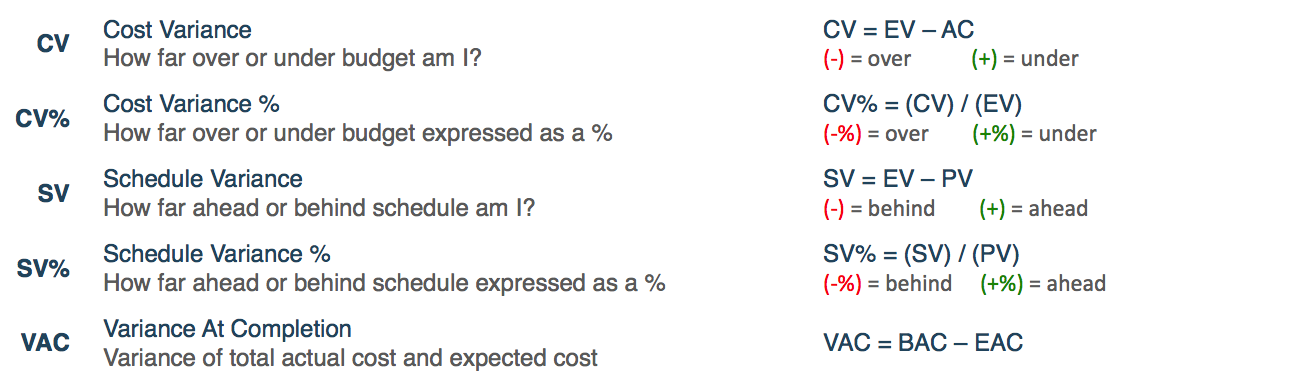
5. CV = Cost Variance (how far over or under budget am I?)
CV = EV – AC
6. CV% = Cost Variance % (how far over or under budget expressed as a %)
CV% = (CV) / (EV) * 100%
7. SV = Schedule Variance (how far ahead or behind schedule am I?)
SV = EV – PV
8. SV% = Schedule Variance % (how far ahead or behind schedule expressed as a %)
SV% = (SV) / (PV) * 100%
9. VAC = Variance at Completion (Variance of total actual cost and expected cost)
VAC = BAC – EAC
EAC is your Estimate at Completion and is explained below.
To summarize the variance calculations:
In addition to your variances you can also calculate your cost and schedule performance index values (CPI and SPI):
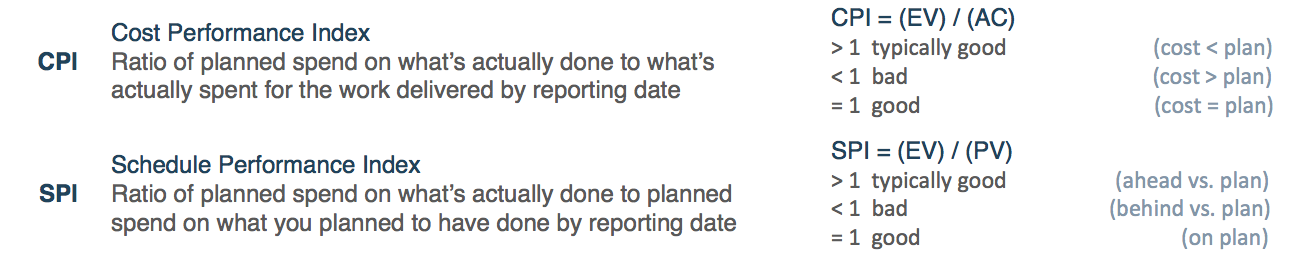
10. CPI = Cost Performance Index
This is the ratio of planned spend on what’s actually done to what’s actually spent for the work delivered by reporting date
CPI = (EV) / (AC)
A value greater than 1 is typically good (it indicates your cost to date is less than planned) and a value less than 1 is typically bad (it indicates your cost to date is more than planned). A value of 1 indicates you are on plan.
11. SPI = Schedule Performance Index
This is the ratio of planned spend on what’s actually done to planned spend on what you planned to have done by reporting date
SPI = (EV) / (PV)
A value greater than 1 is typically good (it indicates your are ahead of schedule vs. plan) and a value less than 1 is typically bad (it indicates you are behind schedule vs. plan). A value of 1 indicate you are on plan.
To summarize the Cost Performance and Schedule Performance Index calculations:
Lastly, with the above calculations completed you can do some project forecasting to see where you expect to end up:
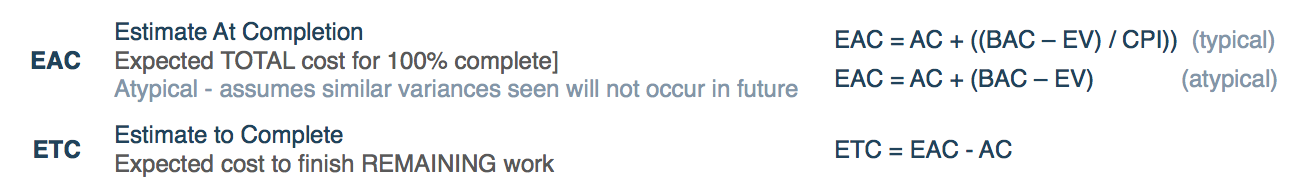
12. EAC = Estimate at Completion
This is the expected total cost to hit 100% complete on your project’s scope. The typical formula to calculate EAC assumes that similar variances to those experienced on the project to date will occur again over the course of the project:
EAC = AC + ((BAC – EV) / CPI))
Alternatively you can calculate EAC assuming similar variance will not occur in the future. You may want to do this in the case of a major one-off event that impacted your project and skewed the index:
EAC = AC + (BAC – EV)
With your Estimate at Completion value you can calculate your Variance at Completion (VAC) against your planned Budget at Completion (BAC)
13. ETC = Estimate to Complete
This is the expected cost to finish the remaining work.
ETC = EAC – AC
To summarize these are the formulas you would use for project forecasting:
6. Reports on $ Expenditure vs. Time
You’ve calculated your earned value, your cost performance index and schedule performance index, and your forecasts for Estimate at Completion (EAC) and Estimate to Complete (ETC). The next step is to take this data and make it visually presentable to project stakeholders – this is done using an S-Curve report.
Reading an S-Curve Report
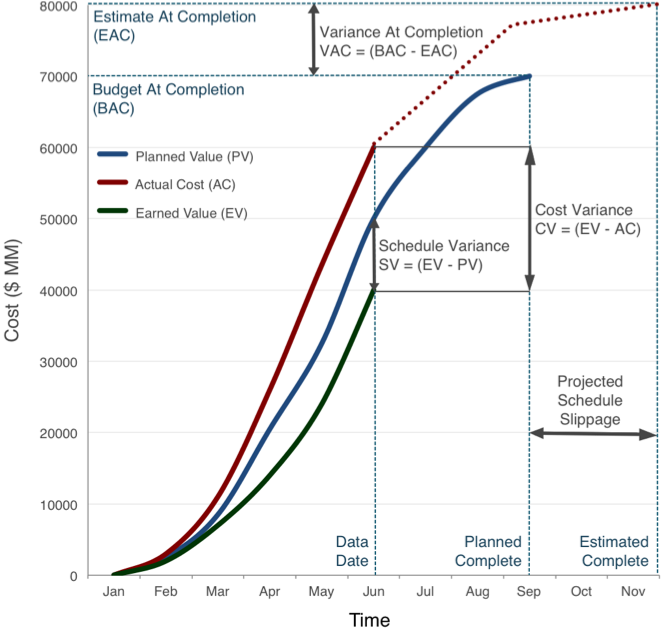
The important report elements:
Data Date
When is this project data as of?
Planned Value > Earned Value
We are behind schedule
Actual Cost > Earned Value
We are over budget
VAC = BAC – EAC (Negative Value)
How far over budget do we
expect to be?
Estimated Complete Date vs. Planned Complete Date
When do we expect to finish?
Earned Value Management: Example
Let’s say you are looking to calculate the Earned Value for a project that has a Project Plan that looks something like this:
Budget = $5MM
Activities = 20 (equally weighted)
Duration = 10 months
And for simplicity we’ll assume the project spend rate is the same each month until completion. At month 5 your personnel in the field are reporting that you are 40% complete on the project and you’ve spent $3MM. What does your Earned Value look like?
To calculate this we work through the formulas provided above:
- BAC = $5MM
- PV = $2.5MM
- AC = $3MM
- EV = BAC *(AC) = $5MM * 0.4 = $2MM
- CV = EV – AC = $2MM – ($3MM = -$1MM (over budget)
- CV% = (CV) / (EV) * 100% = ($1MM) / ($2MM) * 100% = 50% over budget
- SV = EV – PV = $2MM – $2.5MM = -$0.5MM (behind schedule)
- SV% = (SV) / (PV) = ($0.5MM) / ($2.5MM) * 100% = 20% behind schedule
- VAC = BAC – EAC = $5MM – $7.5MM = -$2.5MM (over budget)
- CPI = (EV) / (AC) = $2MM / $3MM = 0.667 (bad: cost > plan)
- SPI = (EV) / (PV) = $2MM / $2.5MM = 0.8 (bad: behind vs. plan)
- EAC = AC + ((BAC – EV) / CPI)) = ($3MM) + (($5MM – $2MM) / 0.667)) = $7.5MM
- ETC = EAC – AC = $7.5MM – $3MM = $4.5MM (expected cost to finish)
Conclusion
This covers the basic concept of Earned Value Management (EVM), S-Curve reports and how to work through the calculations with a simplified example. In practice project plans are much more complex and may require more nuanced indicators of your project’s performance.
Download the Earned Value Management Reference Guide, print it off and take it with you so that you always have at your fingertips a quick reminder as to how earned value is calculated when reviewing your project progress.
Learn how you to improve your progress tracking and delay reports using Industrial Audit’s secure mobile field data collection software and get started today!
Get More Notes
Earned Value Management

Click to download the free reference!